The web page
The page is where people look at the plan. It shows a board, a graph and the history of changes, opens any item in a panel, and lets the current browser user adjust a task's priority.
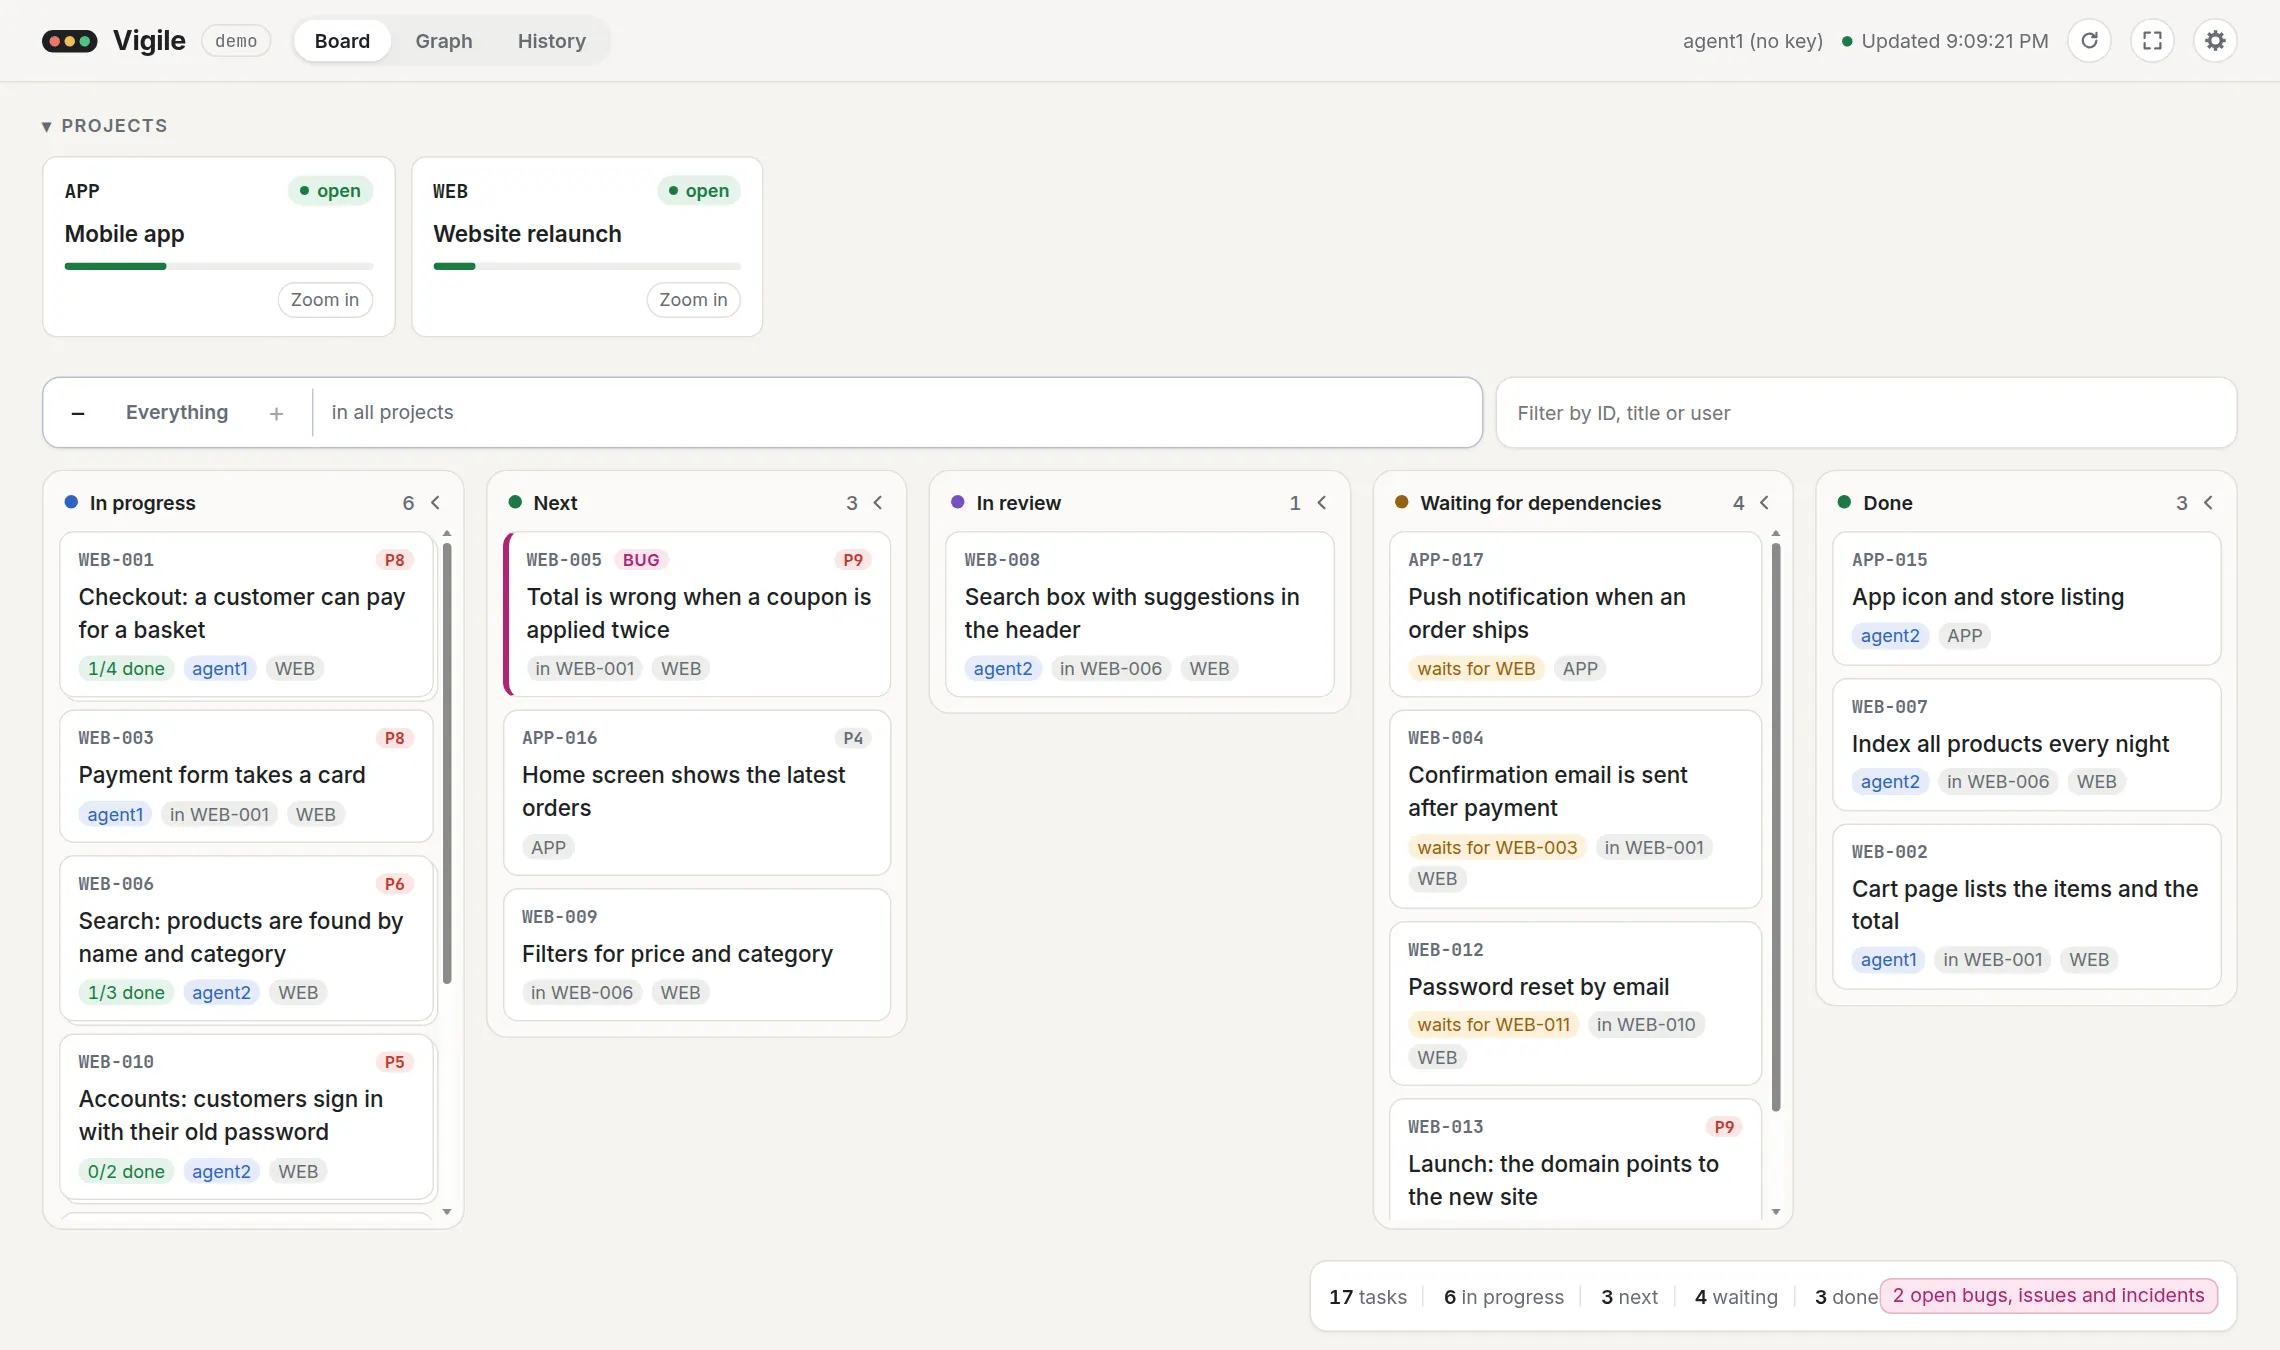
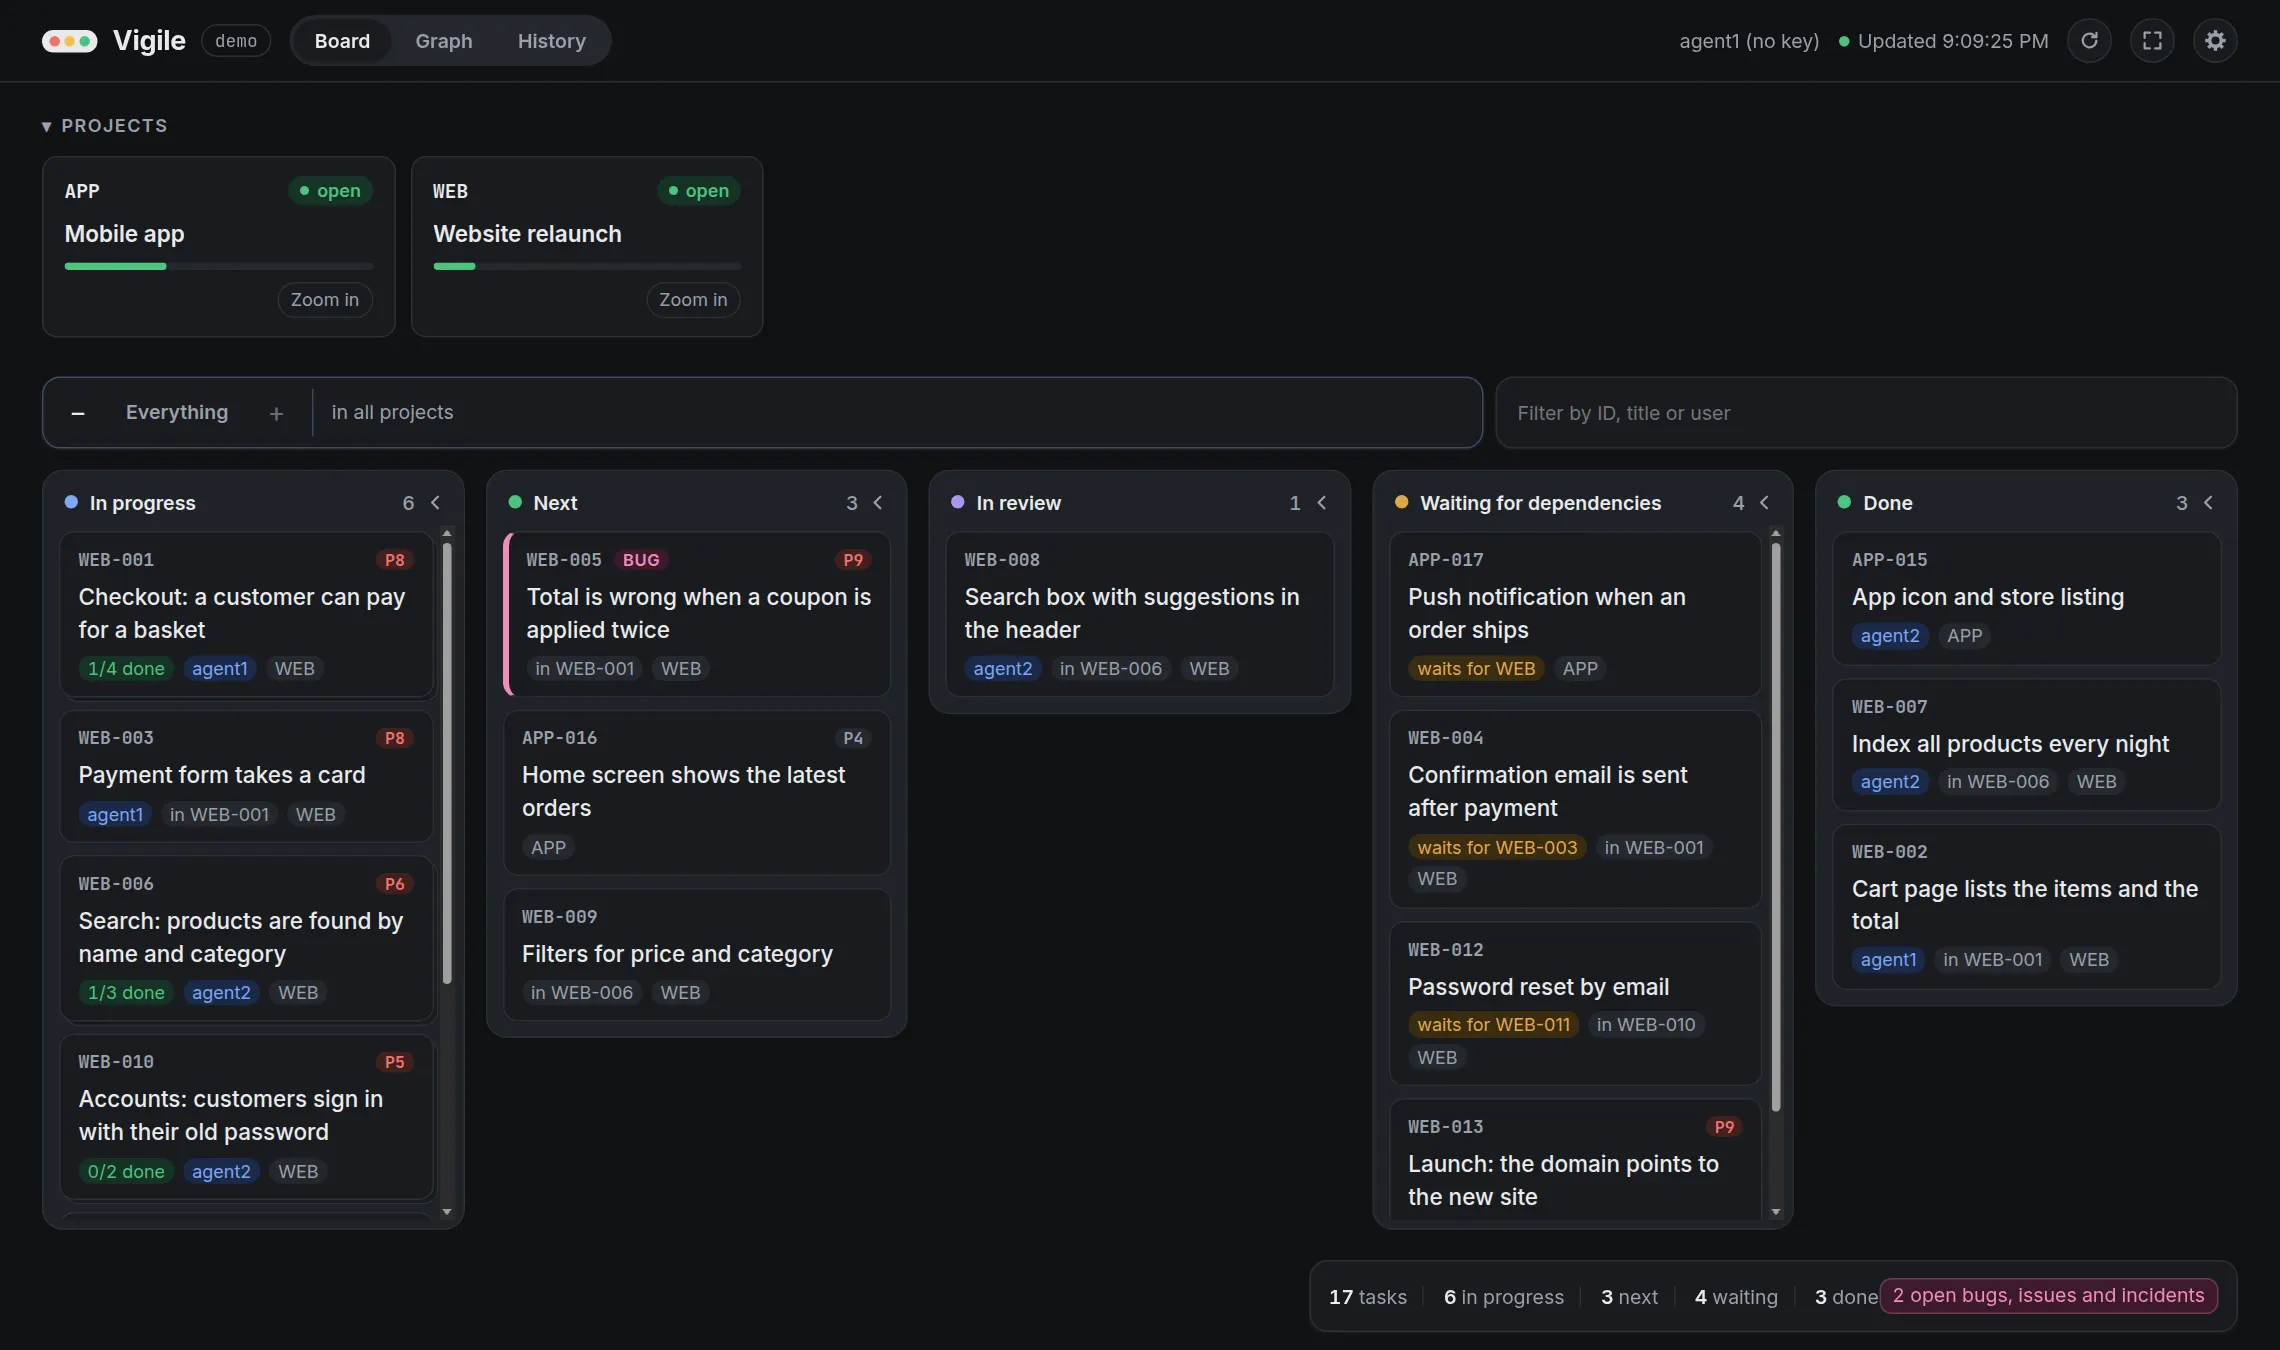
The page is served by the service itself, at the Web address serve prints. It uses the same operations as everyone else: reads for its views and panel, and update_task for priority −/+. The pictures here show made-up data.
The board
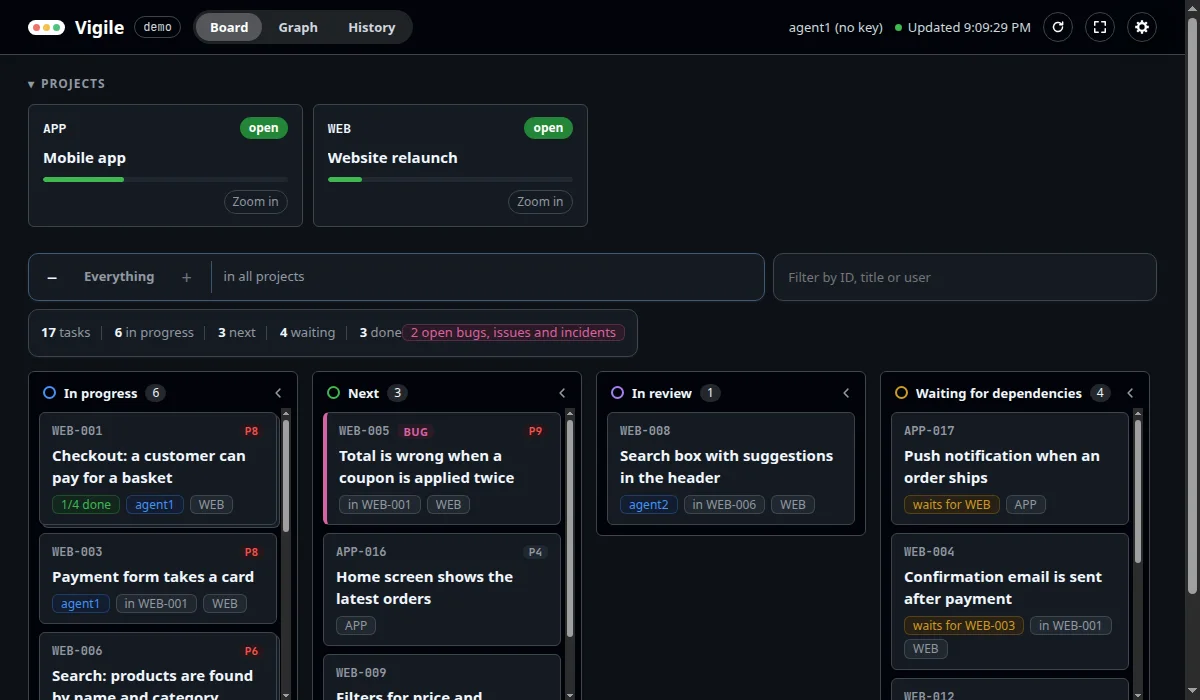
Tasks in columns by state: in progress, next, in review, waiting for dependencies, paused, draft, done, cancelled. In progress, next and done are always there; the others appear when they hold a task.
- A card shows the task's ID, title, priority, who has it, the group and project it is in, and what it waits for.
- A group's card shows its progress, such as "1/4 done".
- Bugs, issues and incidents have their own colour and a label.
- The projects sit above the board. A project's card shows its ID, its status, its title and a bar for its progress. When the project has a problem, "⚠ problems" stands at the bottom left of the card; "Zoom in" is at the bottom right. Selecting and zooming are below.
- The filter narrows the board by ID, title or user, letter by letter. Its clear button removes the typed text and a chosen count, and leaves the keyboard in the filter.
The projects fold into one row, and the button with four corners in the header folds away everything above the board, so that it gets the whole window.
The − and + above the board close or open one level of groups at a time. At Top level, a closed group is one card with its progress, current states, problems and filtered count. “Zoom in” on that card, or “Show only this group” in its panel, opens it alone. A compact breadcrumb returns to any earlier level or leaves the group. A task in several groups appears once as soon as one path to it is open.
A column can collapse to a strip that keeps its name and count. The browser remembers collapsed columns, but they are not part of a shared address. Cards in a collapsed column still count and match the filter; changes ring the strip, and “Open all columns” restores them.
Counts that filter
On a wide window the counts of the board stand together in a small pill, at the bottom-right while the columns scroll by themselves: tasks, in progress, next, waiting and done, with thin dividers between them. A column keeps its own count beside its name.
Two more counts appear in colour when they are not zero: open bugs, issues and incidents, and items with problems. Each is a button. Choosing one shows only the tasks it counts; the count of problems also leaves only the projects with a problem in the row of projects. One count is chosen at a time, and it narrows together with the typed filter. The graph follows it.
The chosen count stays marked. Choose it again, or press "Clear filter" beside it, to see the rest. A chosen count is not part of the address, and is gone when the page is reloaded. On a narrow window the counts are not shown.
Projects: selecting and zooming
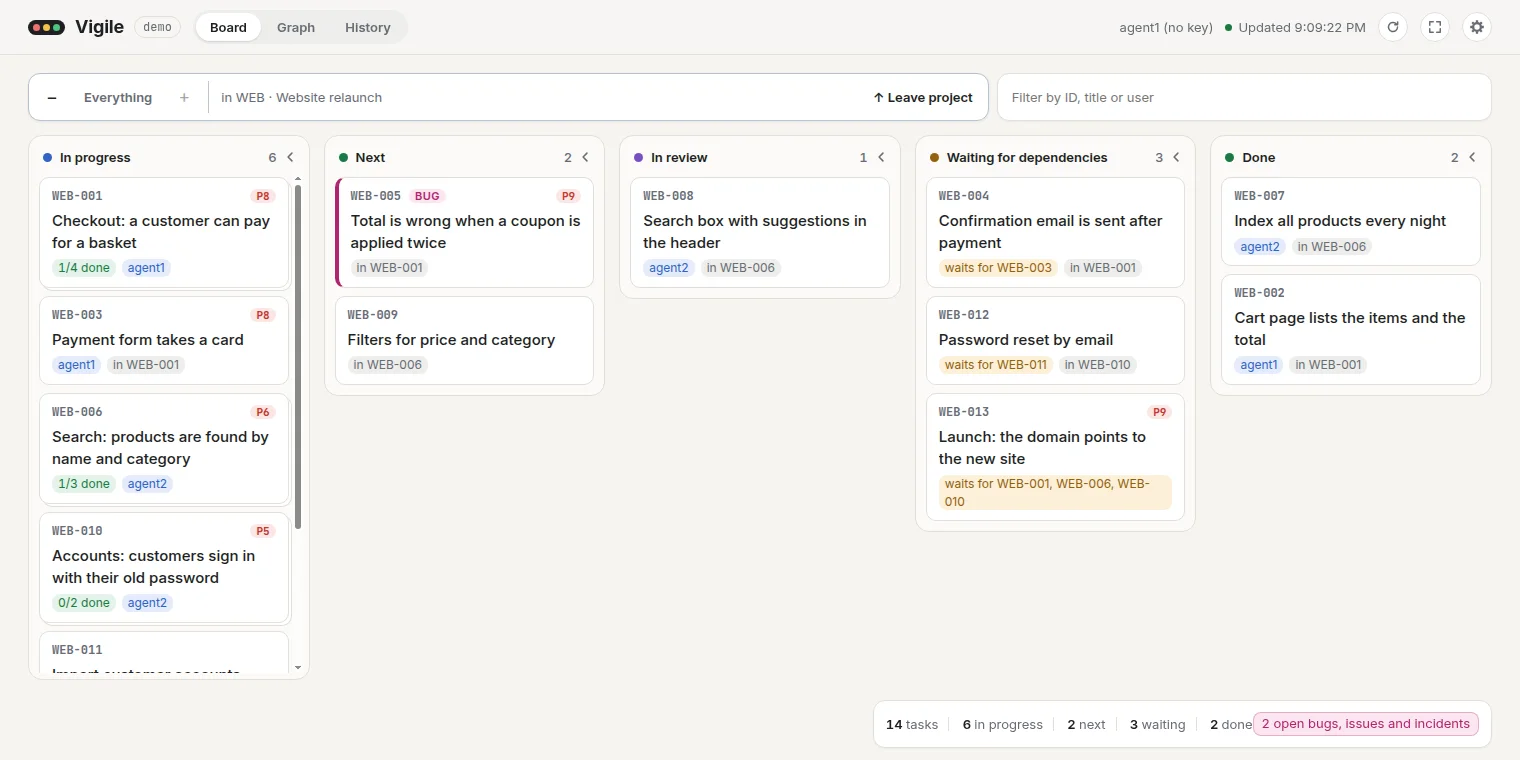
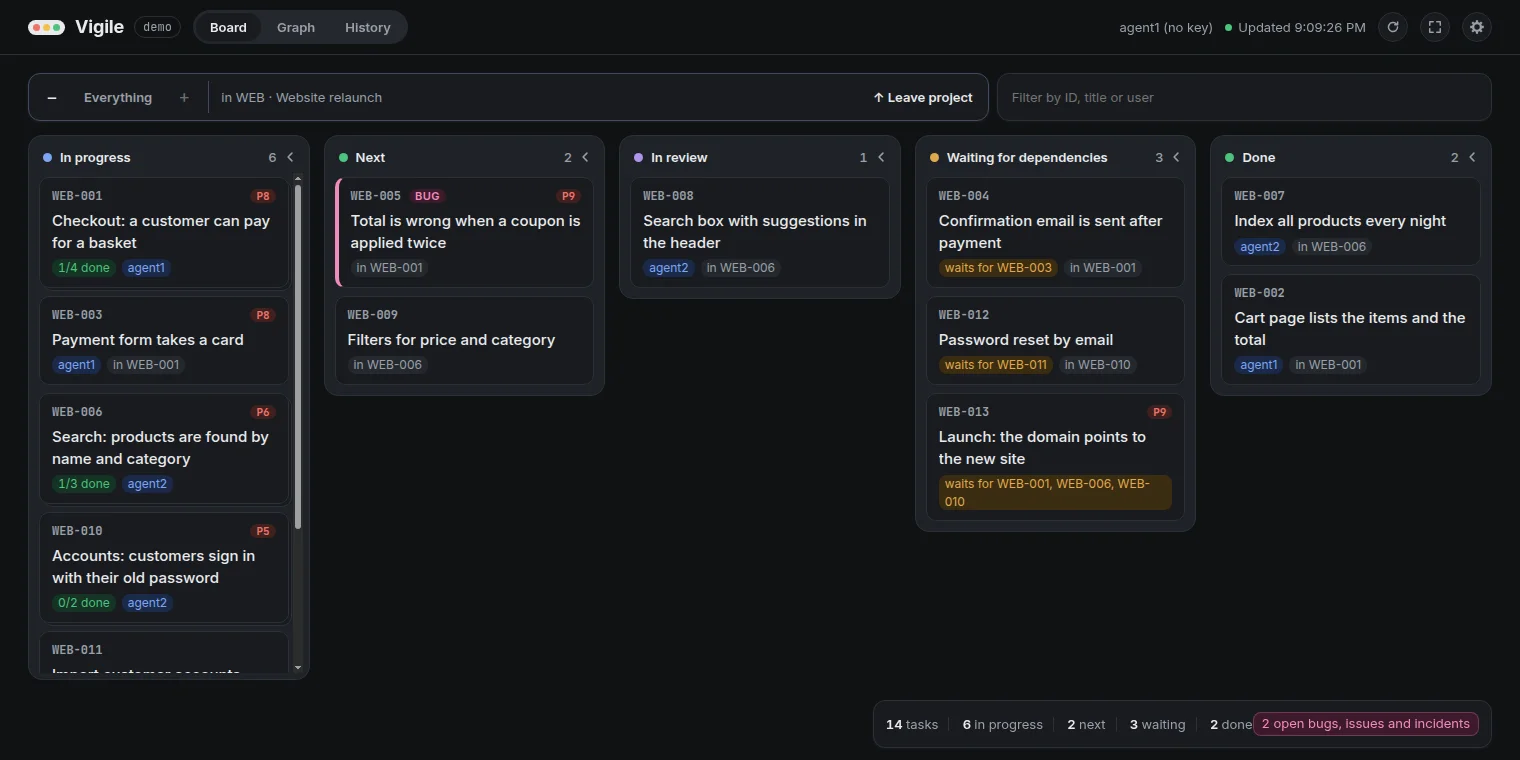
Clicking a project's card selects it: the board, the graph and History show that project only. The other cards are greyed out and can still be chosen. Clicking the selected card again shows the projects together.
"Zoom in" on a card goes one step further. The row of projects is hidden, and the board and the graph show that project alone. The controls above the board name the project and offer "Leave project", which returns to the row of projects with that project selected. With the projects folded into one row, each has a "Zoom" button beside it.
The selection and the zoom each have an address, so a reload, Back and Forward return to them. A project that is no longer in the plan is taken out of the address.
The graph
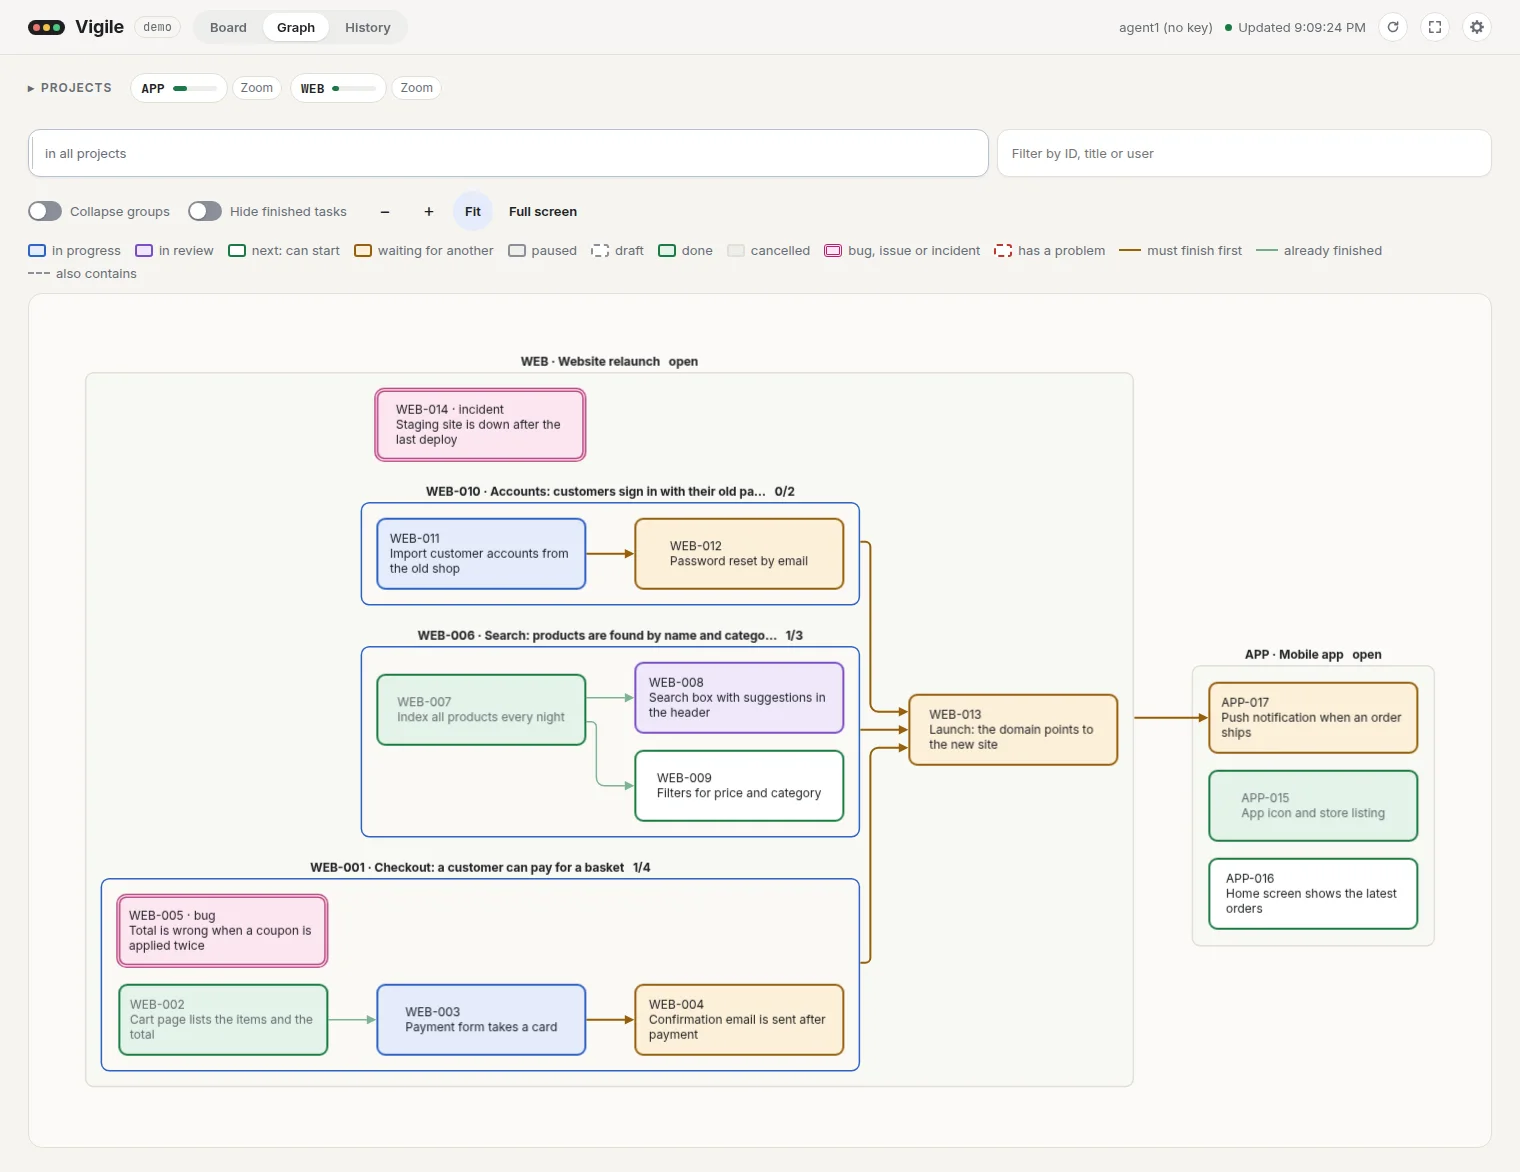
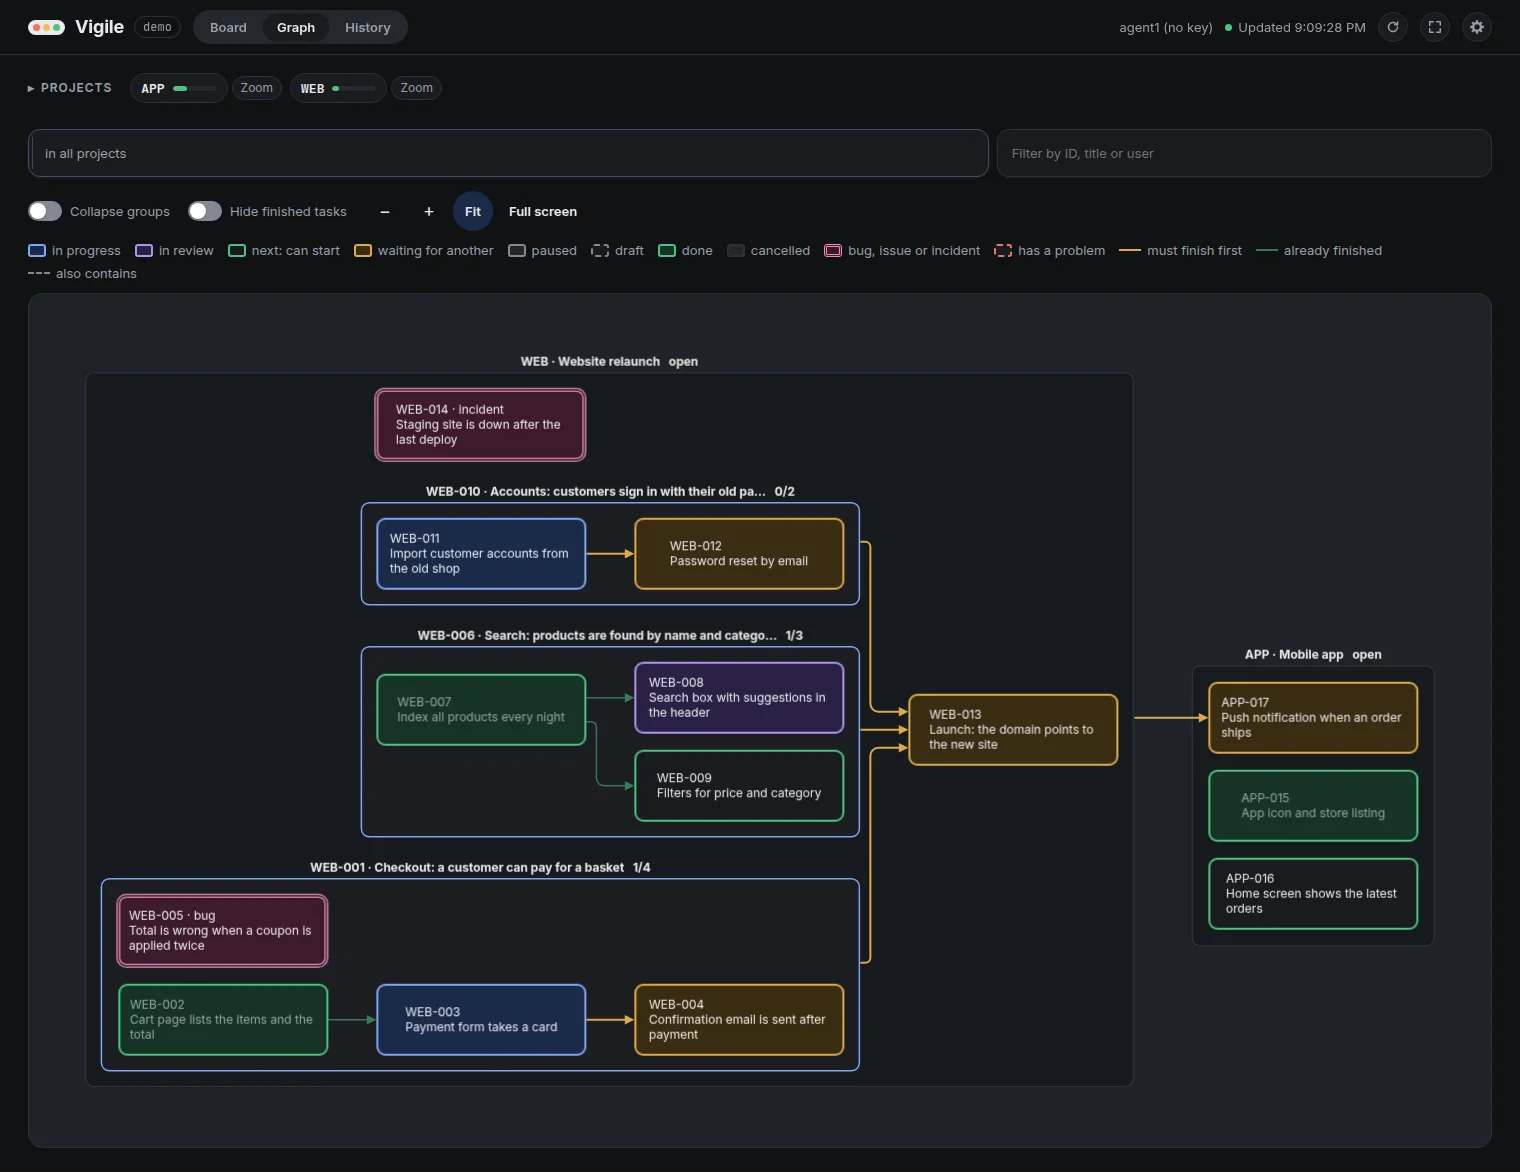
Projects and groups are drawn as boxes around their tasks, with an arrow from each task to the tasks that wait for it. Drag to move it; zoom with the wheel or the buttons. The graph's box reaches the bottom of the window, and "Full screen" gives it the whole screen; Escape brings the page back.
Two switches sit above the graph, because they change what it shows:
| Switch | Does | Starts |
|---|---|---|
| Collapse groups | Shows each group as one item with its progress | on |
| Hide finished tasks | Leaves out tasks that are done or cancelled | off |
The graph is laid out in the background, so the page stays usable while a large plan is worked out. A graph of more than 300 items is not drawn by itself: the page says how many items and arrows it has and draws it when you press "Draw the graph". A large graph that is on screen is not laid out again whenever the plan changes: what is still in the plan goes on showing its present state, what is gone is greyed out, and the page says how many items are new and offers "Draw it again".
The graph shows the selected project, the project or group that was zoomed into and a chosen count as the board does, and follows the typed filter once the typing pauses.
The panel
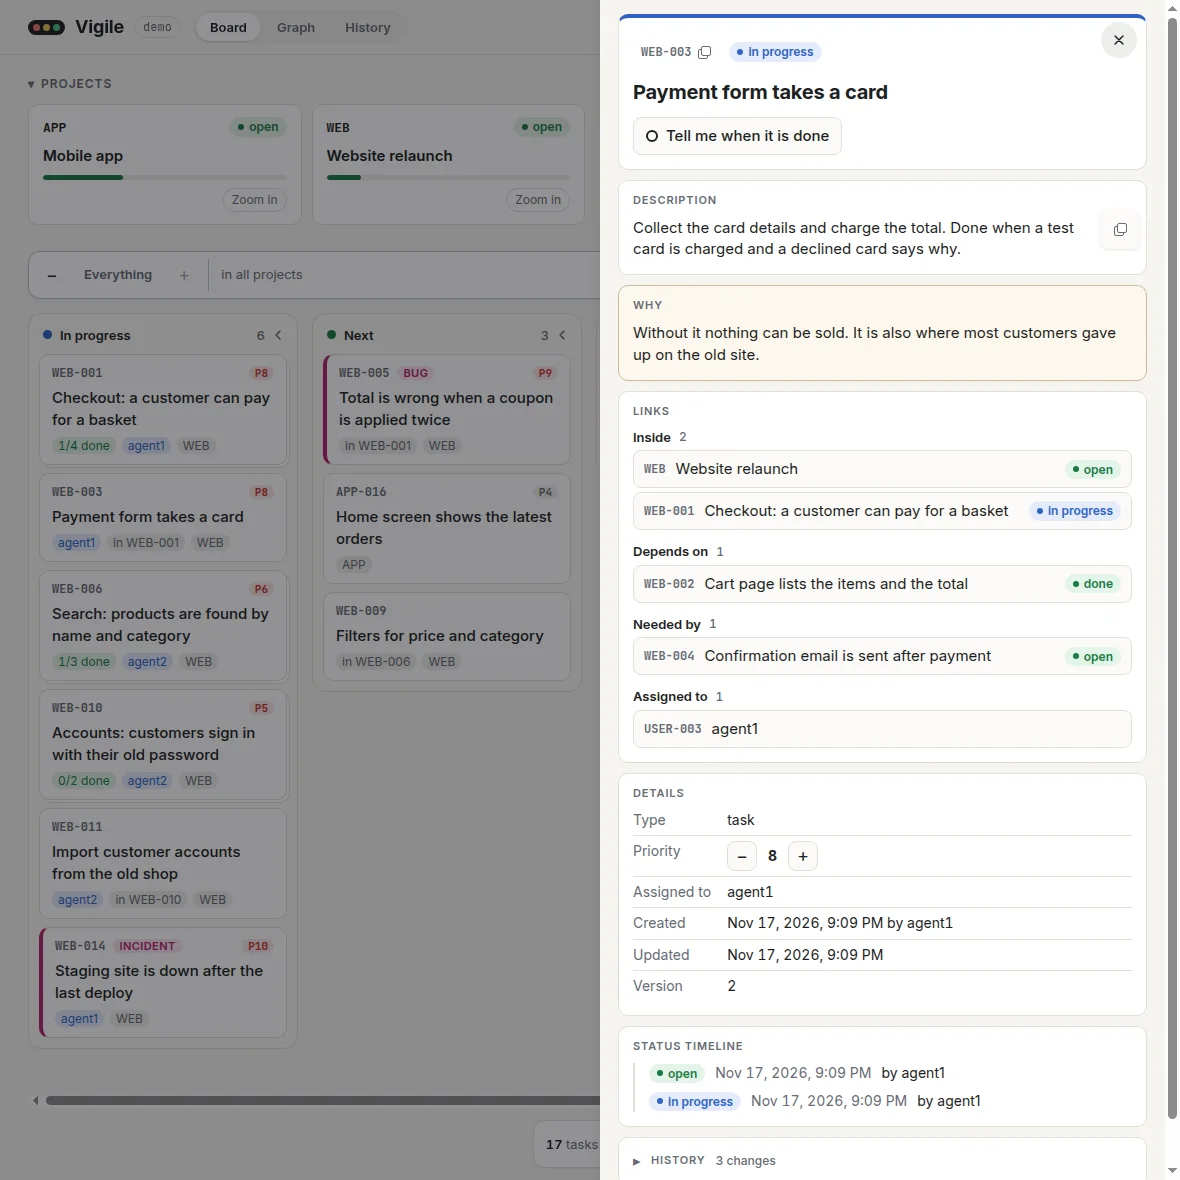
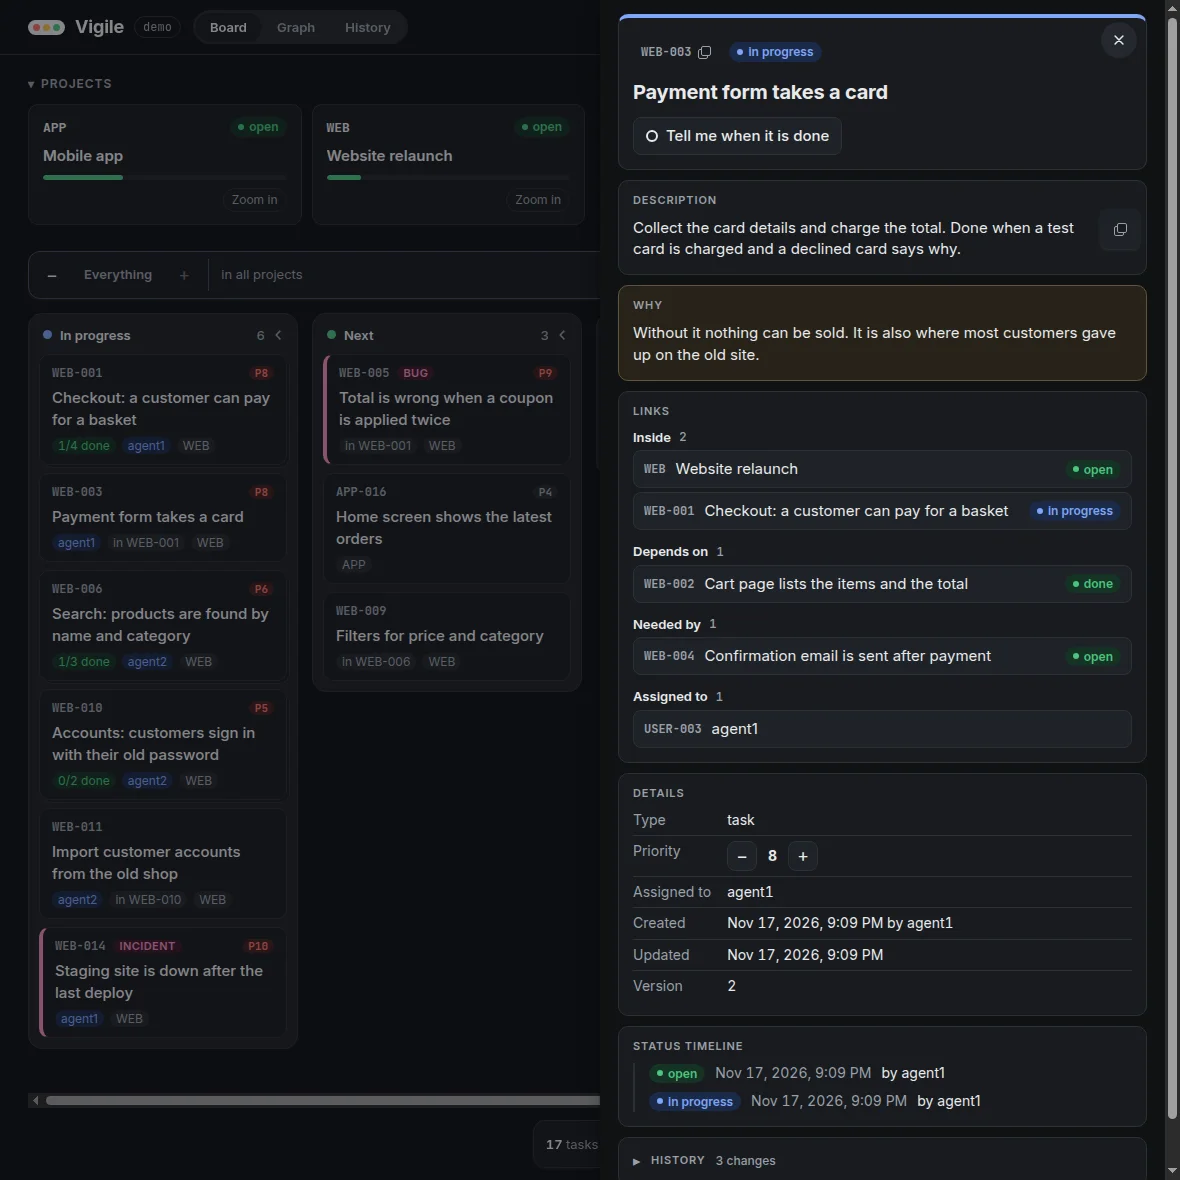
Clicking a task's card, or a task or a project in the graph, opens a panel with its description, reason, links, details, status timeline and history. A project's card has no button for its panel: open a project from the graph, from a link in another panel, from a row of History, or by its address. The details of a done task say how long it took from its creation, under "Took". Following a link in the panel opens the linked item, with a button back to the one you came from. The item ID and description each have a copy control that works with the keyboard and reports success.
In a task's panel, − and + beside its priority call update_task as the current browser user; they are switched off for a deleted task. The rest of the panel only reads the plan.
The panel shows the first 100 links of each kind and the latest 100 timeline and history entries. When more exist, it says how many and reads the next page on request. Pages are combined only while they describe the same item state; if the item changes, the panel starts again. A read that fails keeps what was already shown and offers a retry. An item changing too quickly is shown without further pages, with an explanation.
History
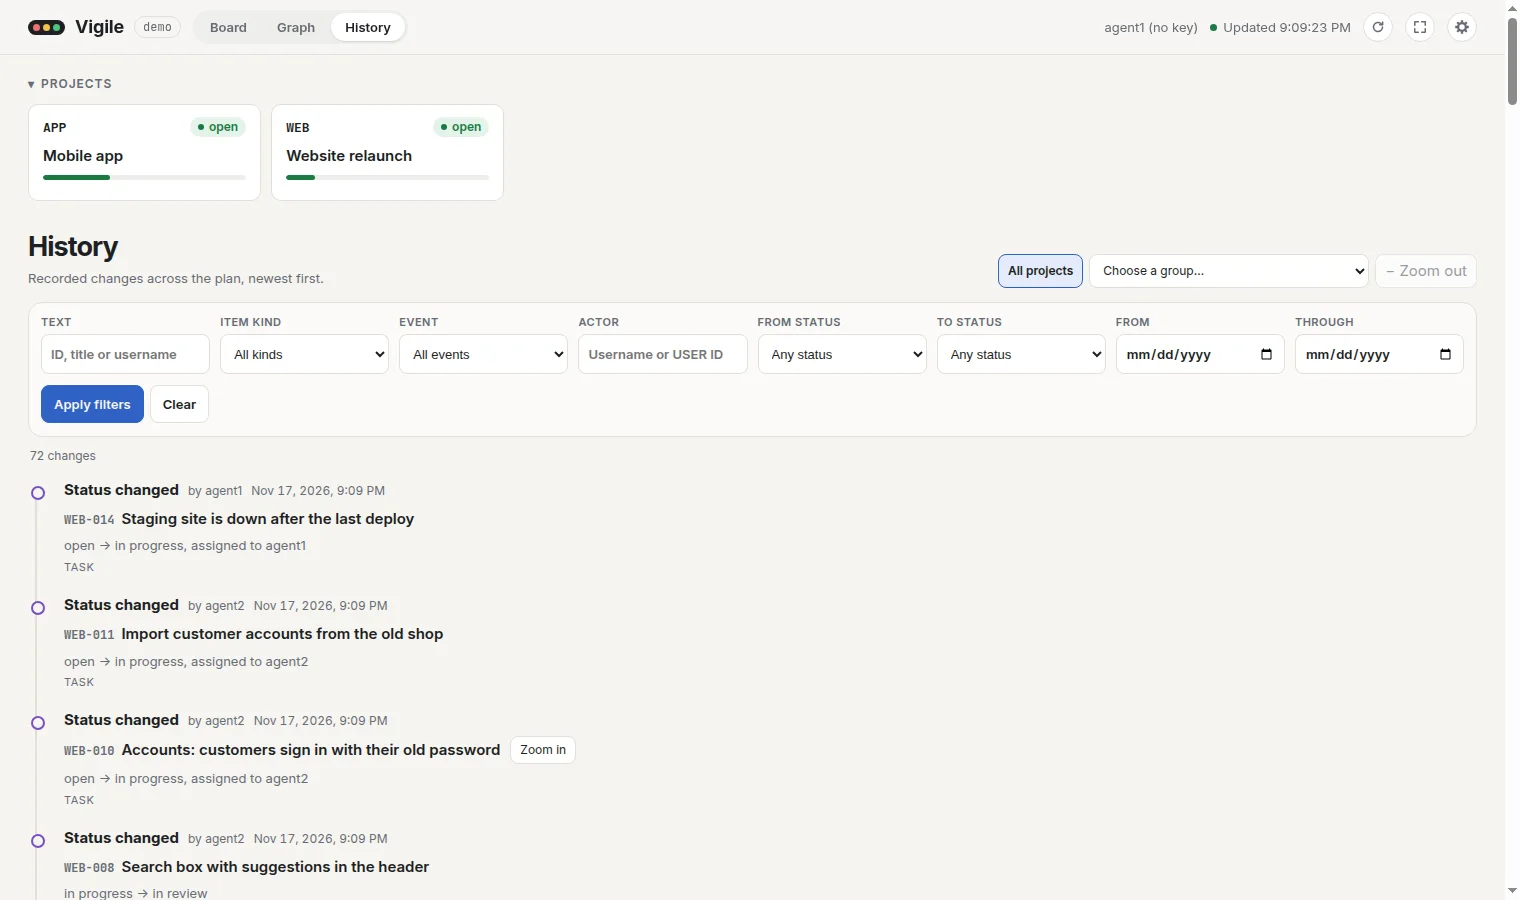
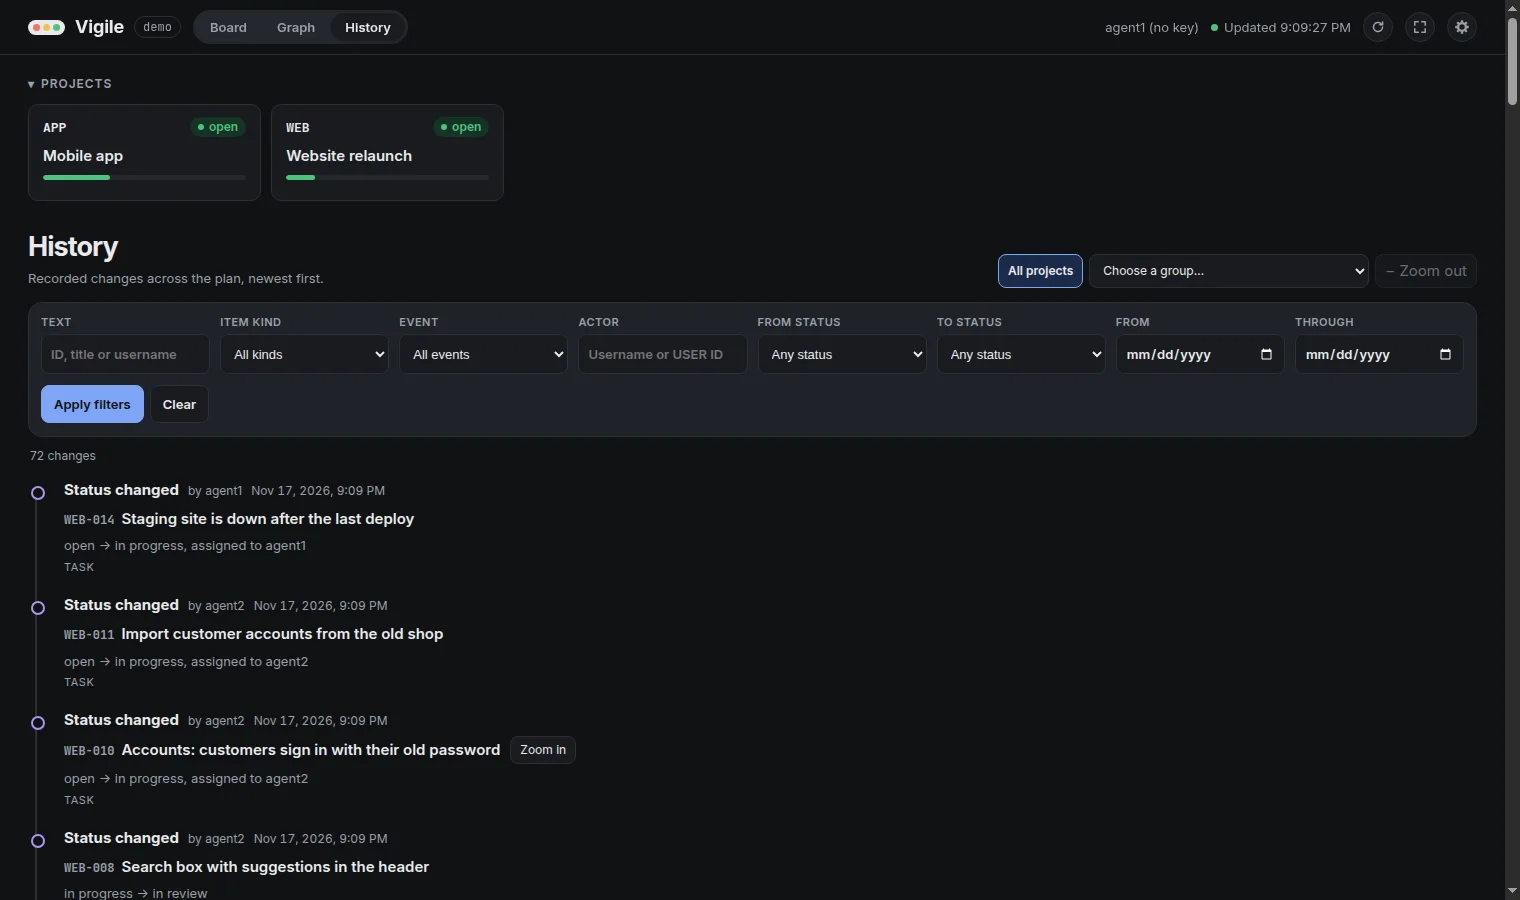
The third view lists the changes recorded across the plan, newest first. It reads them with list_history, 100 at a time; "Load earlier changes" reads the 100 before.
Each row says what was done, by whom and when, and names the item by its ID and its title as it is now. A click on a project or a task opens its panel. Under the item stands what changed, such as "open → in progress, assigned to agent1". A change that set a task to done is labelled "Completed" and says how long the task took from its creation.
History narrows in three ways, which work together:
- A project. Selecting a project's card narrows History to that project and what it holds now.
- A group. "Choose a group…" lists groups to zoom into, and a row about a group has "Zoom in". Inside a group, History lists the changes of the tasks it holds, at any depth, and not the group's own. "Zoom out" and the trail beside it lead back.
- Filters. Text (part of an ID, a title or a username), item kind, event, actor (a username or a user's ID), the status a change left, the status it arrived at, and a first and a last day. They apply when "Apply filters" is pressed, not while typing.
The project, the groups and the filters are in the address, so a reload, a bookmark or a shared link shows the same list.
The browser also remembers the filters that were applied last, in its local storage. Opening History by an address that names no filter brings them back; an address that names a filter is shown as it says. "Clear" empties the filters and forgets them. The project and the group are not remembered: they are in the address only.
History changes nothing in the plan. It is read again when the page is refreshed and, with auto-refresh on, when the plan changes.
Addresses
The views, a selected or zoomed project, a zoomed group, the filters of History and an open item each have an address:
| Address | Shows |
|---|---|
/#board | The board |
/#graph | The graph |
/#history | History |
/#graph/WEB-012 | The graph, with WEB-012 open in the panel |
/#board/project:WEB | The board, with the project WEB open in the panel |
/#board?project=WEB | The board, with the project WEB selected |
/#board?project=WEB&projectZoom=1 | The board, zoomed into the project WEB |
/#board?in=WEB-003&zoom=1 | The top level inside group WEB-003 |
/#history?project=WEB&action=status_changed&toStatus=done | History of WEB: the changes of status that arrived at done |
/#history?in=WEB-003 | History of the tasks inside group WEB-003 |
Bookmark an address or share it; the browser's Back and Forward return to the view, selection, zoom or item before and after.
Not part of an address: the text typed in the board's filter, a chosen count, the two switches above the graph, the folded row of projects and collapsed columns.
Staying up to date
The page loads once and then stays as it is, so that it never changes under your eyes while you read. The refresh button reloads it, and once a minute has passed the header says how old the page is.
With Auto-refresh on, the page listens to the service and shows each change as it happens: a card that moved to another column floats there, a new one fades in, and each is ringed for a moment. The header then says "Live", and the refresh button is not needed and not shown. If the page cannot listen to the service, it asks every 3 seconds instead.
A page that lost the service says so, keeps what it had on screen, and finds the service again by itself.
Settings
The gear button in the header opens the settings, which the browser remembers:
| Setting | Does | Starts |
|---|---|---|
| Auto-refresh | Shows changes as they happen, without reloading | off |
| Scroll columns | Each board column scrolls by itself and the rest of the page stays in view | on |
| Show bugs column | Gathers unfinished bugs, issues and incidents in one column, under a heading for each state | off |
| Sounds: Created, Started, Completed | Three switches, each with a short sound of its own for a task that is created, started or completed, played while the page is open | off |
| Board animations | A card whose task changes state floats to its new column. Off, the card is only ringed | on |
| Background | Slow teal and violet lights move behind the board. They never flash, and text keeps its contrast over them | off |
| System light/dark | The page is light or dark as your system says. Off, a "Dark mode" switch appears and you choose | on |
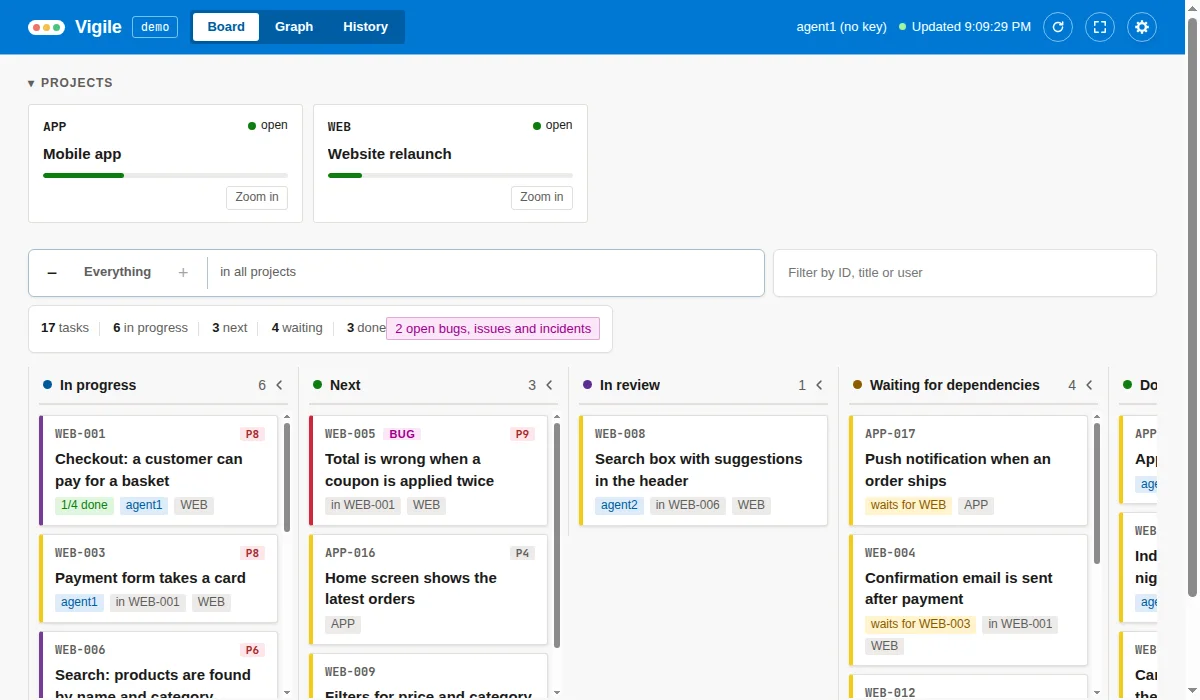
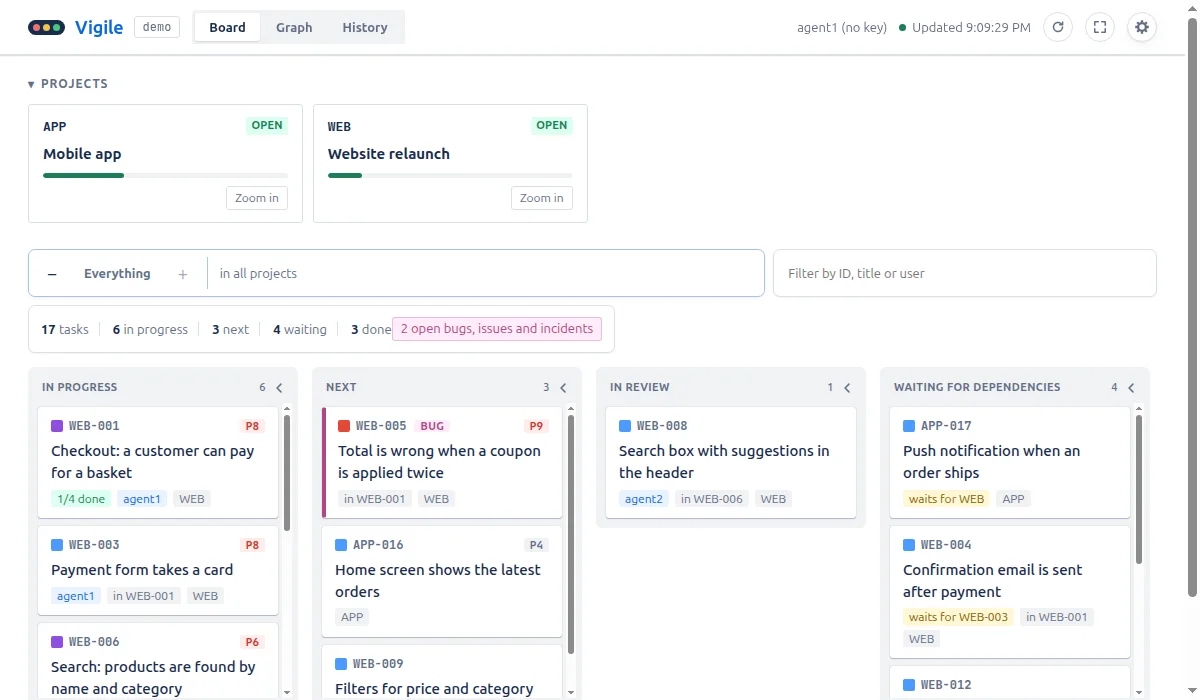
| Theme | Vigile, Dado, Jeev or Gito | Vigile |
Themes
The settings switch the theme on the spot: Vigile, the page's own, and three that follow the look of other tools. A theme changes more than colours: the header bar, how columns and cards are drawn, and what a state label looks like. Each has a light and a dark side, and the graph takes the theme's colours too.
Watching a task
In the panel of an unfinished task, "Tell me when it is done" watches it and closes the panel. When the task is done, the tab plays a short sound and shows a notice, whether or not auto-refresh is on. At most five notices are shown at once; a summary closes them all.
Watching happens in your browser only. The list of watched tasks lives in the tab's session storage, is gone when the tab closes, and is never sent to the service.
On a phone
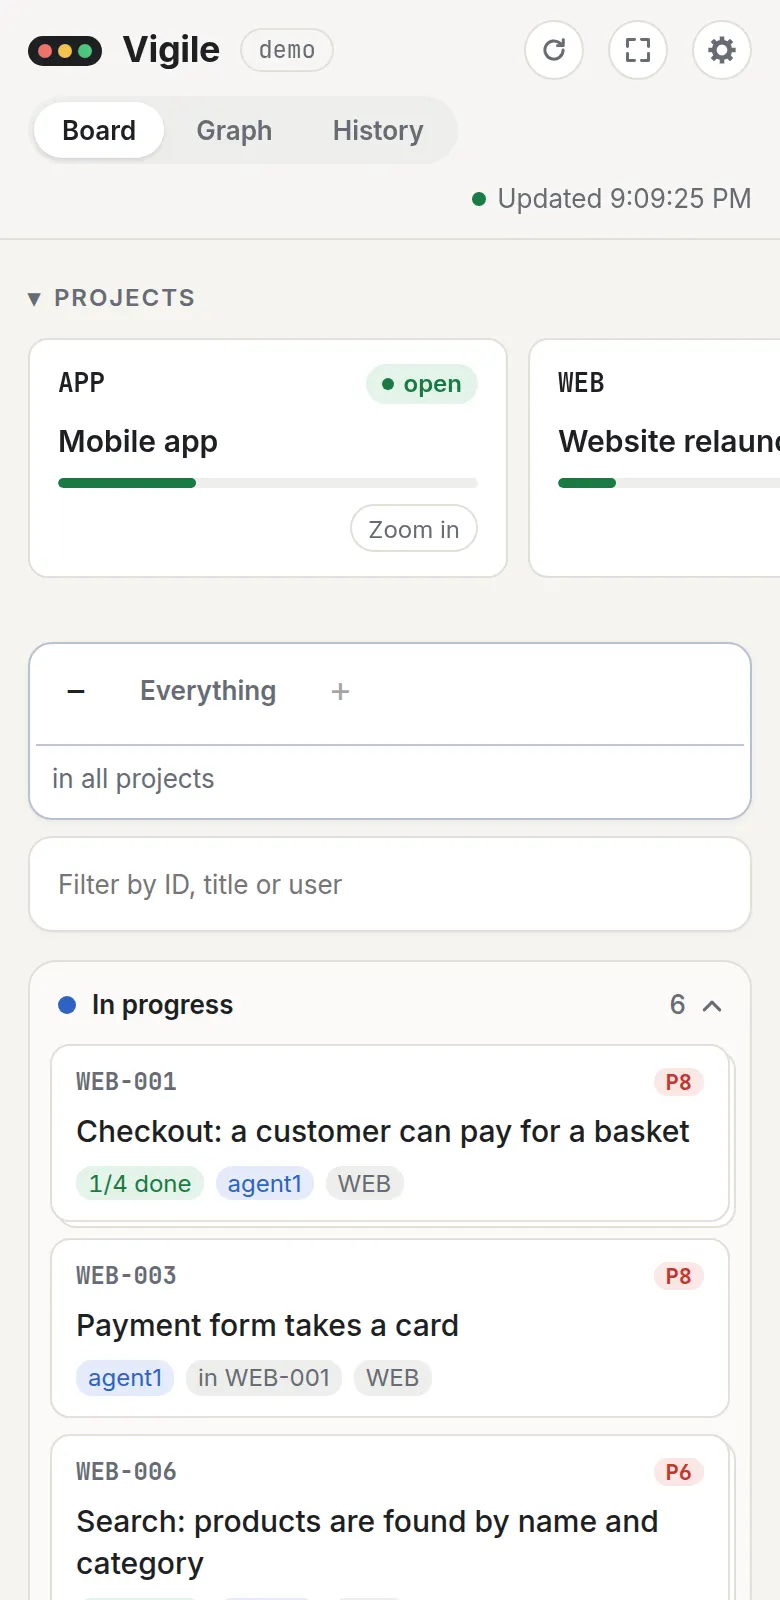
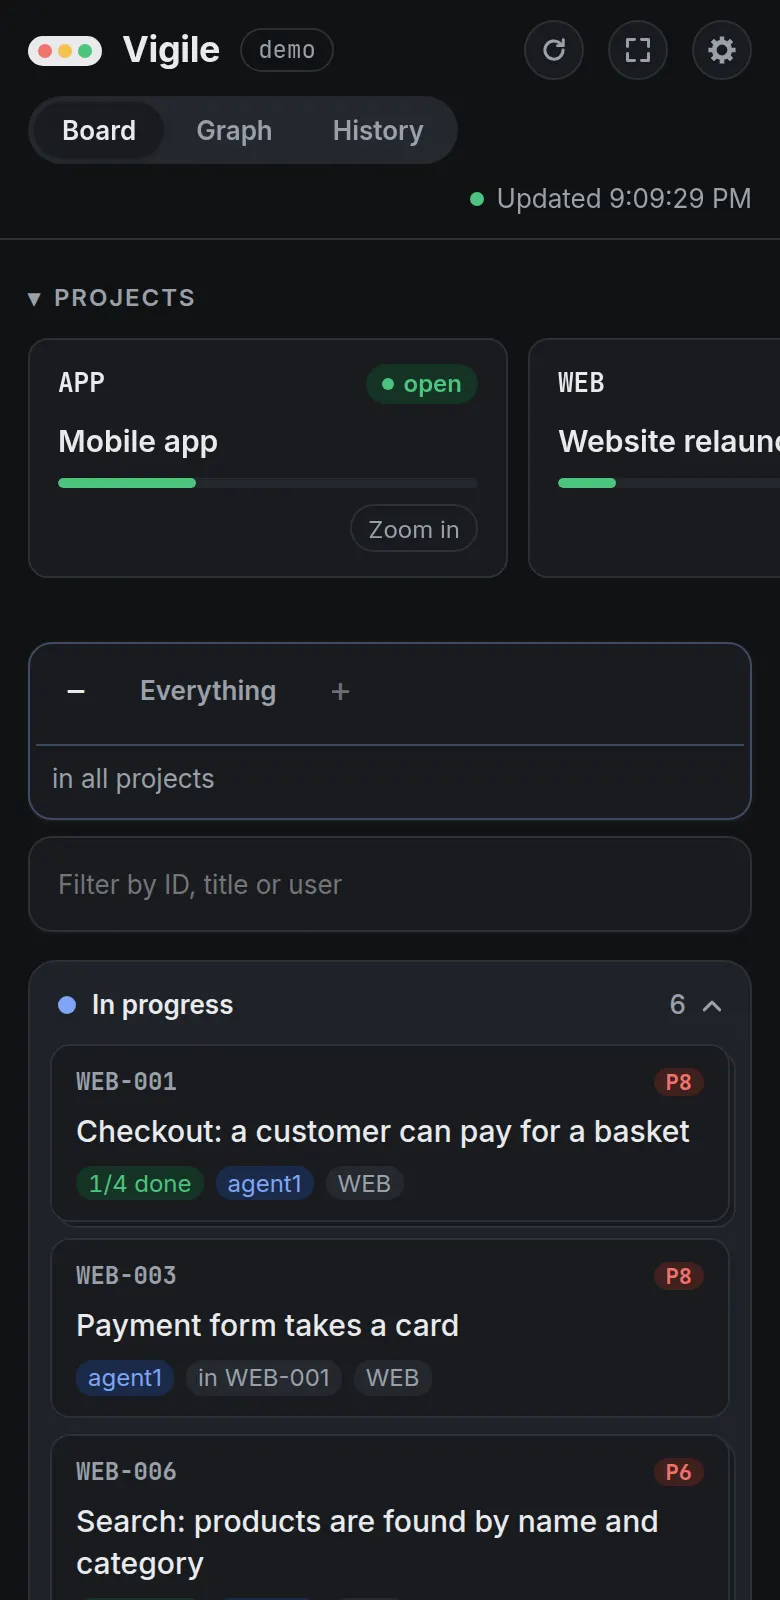
The page works from a phone to a very wide screen. On a phone the columns are stacked and the page scrolls as a whole.
Keys
The page needs no key while the instance lets connections in without one. When a key is required, the page asks for one and keeps it in that browser, in its local storage, beside the page's settings and the History filters applied last. See Security.